


How to Interpret Circular Dichroism Spectra? A Guide to Circular Dichroism Interpretation
Circular Dichroism (CD) spectroscopy is an analytical technique used to study molecular structures, particularly those of biomolecules such as proteins and nucleic acids. It is based on the differential absorption of left-handed and right-handed circularly polarized light by the molecules. Below is a basic guide to interpreting a CD spectrum:
1. Understanding the Chart Structure:
- The horizontal axis (X-axis) typically represents wavelength (measured in nanometers, nm).
- The vertical axis (Y-axis) represents the absorption difference, i.e., circular dichroism (measured in ellipticity, mdeg) or the differential extinction coefficient at specific wavelengths.
2. Wavelength Range:
- Different types of samples require different wavelength ranges. For example, proteins are typically analyzed in the 190-250 nm range, whereas nucleic acids are analyzed in the 260-320 nm range.
3. Identifying Characteristic Peaks:
- The CD spectrum of proteins often shows two characteristic peaks near 208 nm and 222 nm, associated with α-helix structures.
- β-sheet structures typically display a minimum around 215 nm.
- Random coil structures exhibit a weaker minimum around 195 nm.
4. Analyzing the Secondary Structure of Samples:
- Based on the position and shape of the peaks, one can infer the proportion of secondary structures in the sample (such as α-helix, β-sheet, β-turns, and random coils).
- Specialized software can assist in quantitatively analyzing these structural proportions, such as DichroWeb, CDPro, and K2D3.
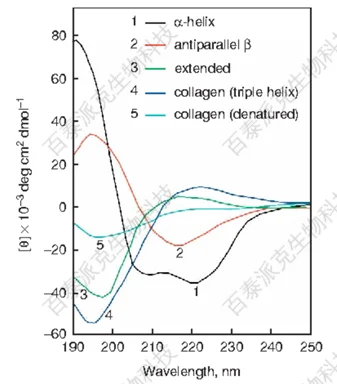
Figure 1. Circular Dichroism Spectrum
BiotechPack, A Biopharmaceutical Characterization and Multi-Omics Mass Spectrometry (MS) Services Provider
Related Services:
Circular Dichroism Analysis (CD)
Submit Inquiry
Name *
Email Address *
Phone Number
Inquiry Project *
Project Description*
How to order?
