How to analyze a biplot?
A biplot is a two-dimensional or three-dimensional graphical tool that combines the results of Principal Component Analysis (PCA), displaying both the distribution of samples (points) and the contribution of variables (loading vectors). When analyzing a biplot, you should focus on the following key points:
1. Understanding the Basic Structure of a Biplot
1. A biplot is composed of principal components (PCs), usually two-dimensional (PC1 and PC2), which can explain most of the variance in the data.
2. Points in the plot represent samples (observations), while arrows or vectors represent variables. The distribution of sample points reflects the similarity between samples, and the direction and length of variable vectors represent their contribution to the principal components.
2. Interpreting Variable Vectors
1. Length of Vectors: The longer the vector, the greater the contribution of the variable to the principal components. In PCA, the length of the vector reflects the variance contribution of the variable on the selected principal components.
2. Direction of Vectors: Vectors pointing in similar directions indicate positive correlation between variables; opposite directions indicate negative correlation; perpendicular vectors suggest low or no correlation between variables.
3. Position of Sample Points
1. The position of sample points is projected in the principal component space based on the linear combination of variables. Samples that are close to each other indicate high similarity in the principal component space, meaning their variable measurements are close.
2. The distance and angle between sample points and variable vectors can explain the sample's performance on that variable. For instance, a sample point close to a variable arrow indicates a high score on that variable.
4. Analyzing the Interpretability of Principal Components
1. Check the proportion of variance explained by PC1 and PC2, usually annotated on the axes of the biplot. The higher the combined interpretability of PC1 and PC2, the better these two principal components reflect the variability of the original data.
2. If the interpretability of PC1 and PC2 is low (e.g., below 50%), it may be necessary to examine other principal components or reconsider whether the data is suitable for PCA analysis.
5. Relationship between Variables and Samples
1. If certain sample points are concentrated along the direction of a variable vector, it indicates that these samples have high scores on that variable, which can be used to identify samples that stand out in certain variables.
2. By observing the distribution of sample points on different principal components, the main sources of variability in a multivariate dataset can be revealed. For example, it can identify which samples stand out in certain variables, facilitating more targeted research.
6. Interpretation of Multiple Components
1. If samples are categorized by a factor (such as experimental treatment, different groups, etc.), the samples of different groups can be annotated on the biplot to further analyze the differences between samples.
2. Combining experimental design can explain whether the principal components can distinguish sample groups, thereby inferring the role of these variables in group differences.
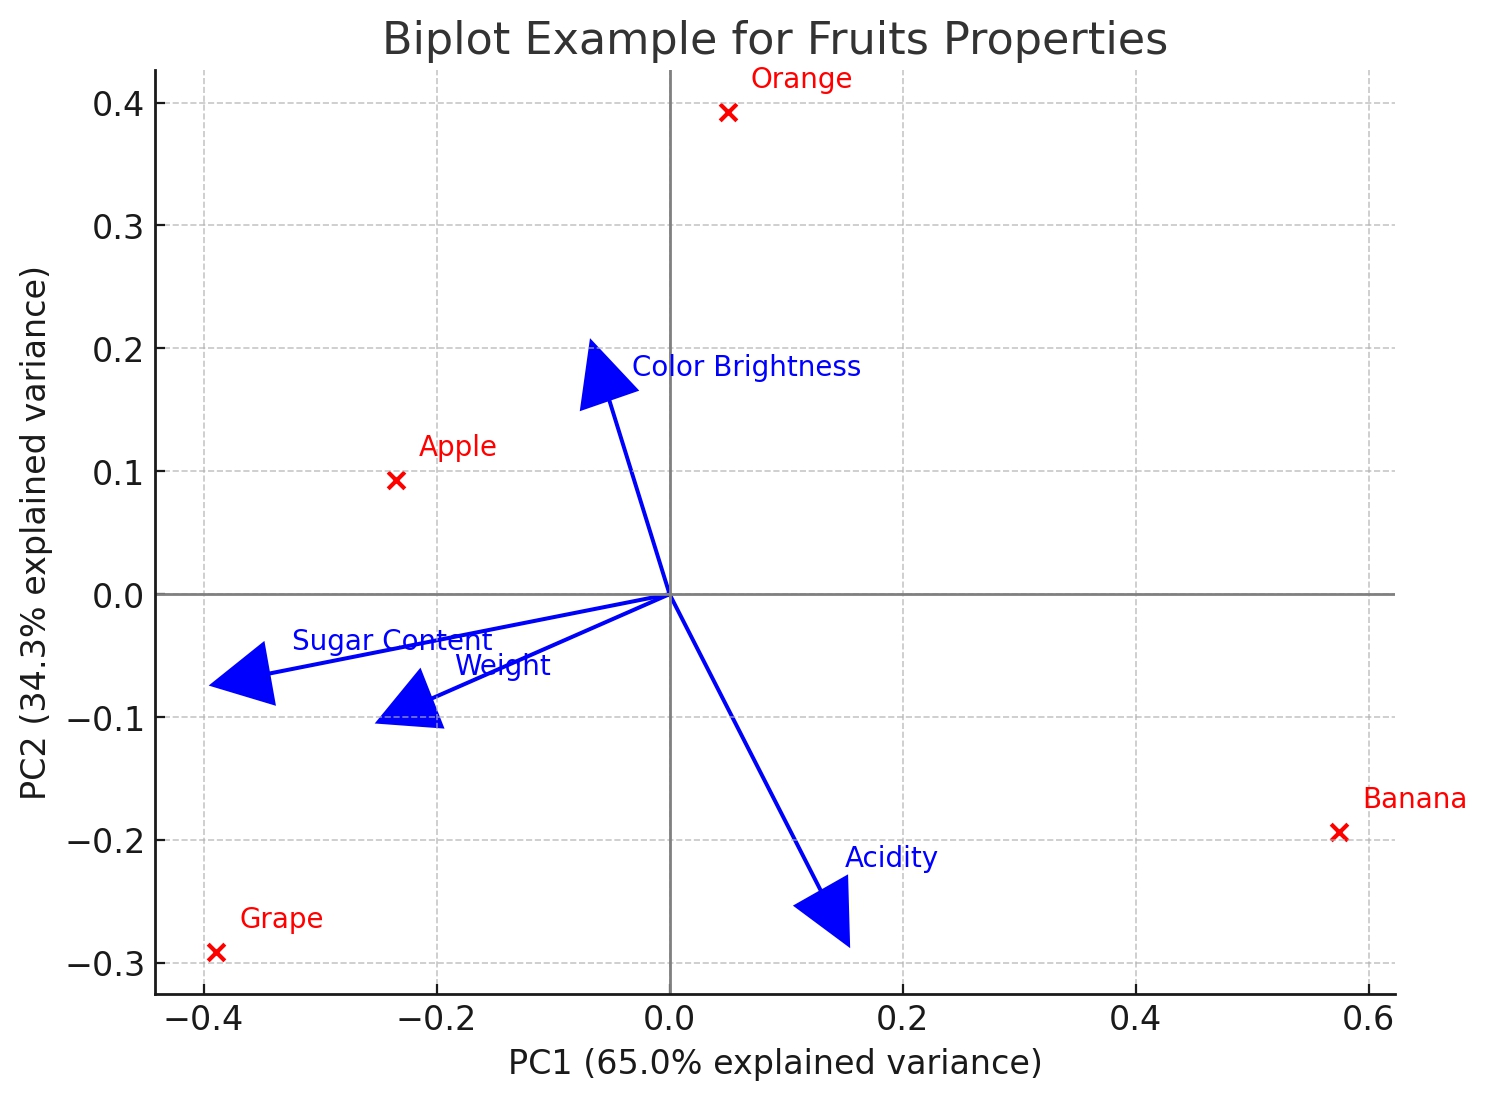
Below is a simple example of analyzing a biplot to help you better understand visually.

1. Explanation of Principal Components
- PC1 explains 60% of the variance, and PC2 explains 25% of the variance. A total of 85% of the variance is captured by the first two principal components.
2. Distribution of Samples
The fruit samples are distributed in a two-dimensional space, such as:
- Apples and oranges are close to each other in the upper right of the plot, indicating that they have similar characteristics.
- Bananas are located at the lower left of the plot, showing significant differences from other samples, indicating that bananas have different characteristics on these two principal components compared to other fruits.
3. Loading Vectors of Variables
- Weight: The arrow points to the upper right and is relatively long, indicating that 'weight' has a significant contribution to PC1 and is positively correlated with PC1. Samples close to the upper right corner, such as apples and oranges, have higher weight.
- Sugar Content: The arrow points to the right and is also long, indicating that 'sugar content' has a significant contribution to PC1, and there is a positive correlation between sugar content and weight.
- Acidity: The arrow points to the lower left and is relatively long, indicating that 'acidity' has a significant contribution to PC2 and is negatively correlated with weight. Banana samples close to this arrow indicate higher acidity in bananas.
- Color Brightness: The arrow points to the lower right and is relatively short, indicating that color brightness has a smaller contribution to both PC1 and PC2 and is nearly uncorrelated with other variables.
4. Relationship between Variables
- Weight and Sugar Content: The arrows of these two variables are almost parallel, indicating a high positive correlation, meaning heavier fruits usually have higher sugar content.
- Weight and Acidity: The arrow of weight and the arrow of acidity point in opposite directions, indicating a negative correlation, meaning heavier fruits tend to have lower acidity.
5. Relationship between Samples and Variables
- Apples and oranges are close to the arrows of 'weight' and 'sugar content', indicating they are heavier and have higher sugar content.
- Bananas are close to the arrow of 'acidity', indicating higher acidity in bananas.
- The arrow of color brightness is relatively short, indicating it plays a smaller role in distinguishing fruits and may not be the main factor determining sample differences.
Through this plot, you can see the distribution of different fruits in terms of their physical and chemical properties, as well as the relationships between variables, such as the positive correlation between 'weight' and 'sugar content' and the negative correlation between 'acidity' and 'weight'.
BiotechPack, A Biopharmaceutical Characterization and Multi-Omics Mass Spectrometry (MS) Services Provider
Related Services:
Principal Component Analysis (PCA)
How to order?


