


How to Analyze Infrared Spectra
Infrared spectroscopy is a technique used to identify chemical substances by analyzing changes in the vibrational frequencies of chemical bonds within molecules. Interpreting IR spectra mainly involves identifying characteristic absorption peaks, which correspond to the vibrational frequencies of different functional groups within the molecule.
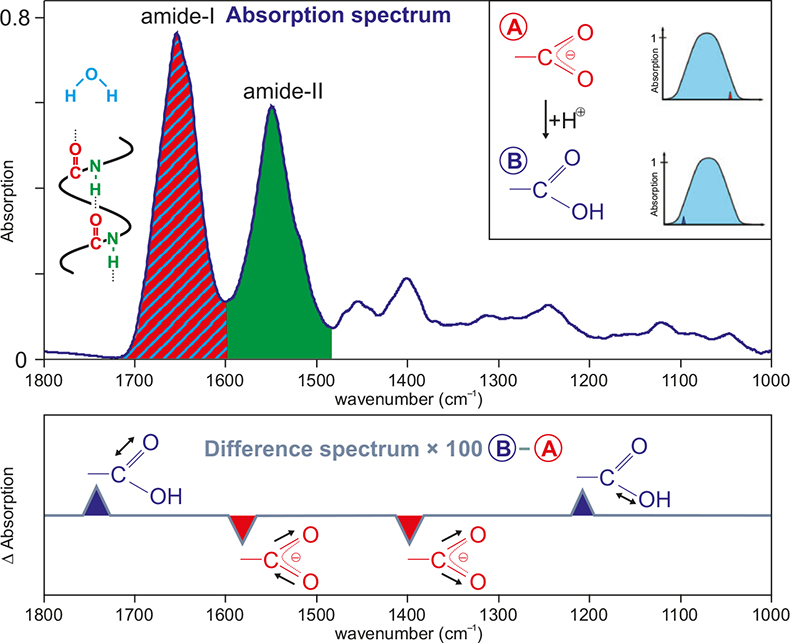
Figure 1. Typical infrared absorption spectrum of a protein solution
Below are the basic interpretation steps and some key points:
1. Basic Concepts
-
Wavenumber (usually in cm−1represents the position of absorption peaks in the infrared spectrum. It is a measure of the absorption frequency, related to the difference in vibrational energy levels.
-
Absorption peaks: Appearing as upward peaks on the spectrum, their position (wavenumber) and intensity can provide information about the chemical bonds and functional groups present in the molecule.
2. Key Wavenumber Regions and Corresponding Functional Groups
-
3200-3600 cm^-1: O-H bond stretching vibration (broad band, can be seen in alcohols, phenols, and water); N-H bond stretching vibration (generally around 3300-3500 cm−1nearby, may appear as a pair of peaks).
-
2800-3000 cm^-1: C-H bond stretching vibration (found in alkanes).
-
2250-2100 cm^-1: C≡C and C≡N triple bond stretching vibrations.
-
1680-1750 cm^-1: C=O double bond stretching vibration (carbonyl, such as ketones, esters, amides, etc.).
-
1600-1580 cm^-1 and 1500-1400 cm^-1: Corresponding to aromatic compounds' C=C bond stretching and C-H bending vibrations.
-
1450-1370 cm^-1: C-H bond bending vibrations (found in alkanes).
-
1300-1000 cm^-1: C-O bond stretching vibrations (alcohols, ethers, esters, etc.).
3. Interpretation Steps
1) Identify broad and sharp peaks: Broad bands are usually associated with O-H or N-H bond stretching vibrations, while sharp peaks may correspond to functional groups like C=O.
2) Determine wavenumbers: Match the wavenumbers of characteristic peaks with known functional group absorption regions.
3) Analyze peak shape and intensity: The shape and intensity of peaks can provide additional information about the types and environments of bonds in the molecule.
4) Consider the fingerprint region: The region below 1000 cm−1is known as the fingerprint region. Although complex and difficult to interpret directly, it is very useful for the specific identification of compounds.
4. Comprehensive Analysis
Compare the observed absorption peaks with possible structural features of the compound. Consider all information comprehensively to determine the specific structure of the compound. In practice, reference to standard spectra or databases is usually required to ensure the accuracy of the interpretation.
BiotechPack, A Biopharmaceutical Characterization and Multi-Omics Mass Spectrometry (MS) Services Provider
Related Services:
Infrared Spectroscopy Analysis (FT-IR)
Disulfide Bond/Free Cysteine Detection
Circular Dichroism Analysis of Proteins
How to order?
