


Unveiling Protein Conformation: In-Depth Interpretation of Circular Dichroism Spectroscopy Analysis Techniques
Introduction
Proteins are essential functional molecules within living organisms, and their conformation determines their function and interaction modes. Circular dichroism (CD) spectroscopy is a commonly used technique that can reveal conformational information about proteins. This article provides an in-depth interpretation of CD spectroscopy, guiding you in exploring the mysteries of protein conformation.
1. What is Circular Dichroism Spectroscopy?
Circular dichroism spectroscopy is a method used to analyze protein conformation by measuring the absorption and scattering of circularly polarized light at different wavelengths. CD spectra can provide information on the secondary structure, folding state, and interactions of proteins. By analyzing CD spectra, we can understand the conformational characteristics of proteins, thereby deeply investigating their function and mechanisms of interaction.
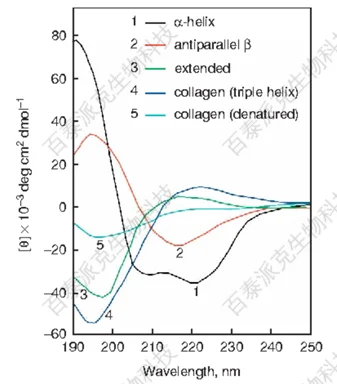
Figure 1
2. Interpretation of Circular Dichroism Spectra
1. Characteristics of α-Helix and β-Sheet
In CD spectra, α-helices and β-sheets are common secondary structures of proteins. The α-helix exhibits a negative absorption peak in the 190-200 nm range, while the β-sheet shows a positive absorption peak in the 200-230 nm range. By observing the intensity and position of these peaks, we can preliminarily determine the secondary structure composition of proteins.
2. Protein Folding State
CD spectra can also provide information about the protein folding state. For folded proteins, the CD spectrum shows distinct characteristic peaks; for unfolded proteins, the spectrum is relatively flat. By analyzing the shape of the spectrum and the position of characteristic peaks, we can understand the folding state of proteins and infer their stability and function.
3. Protein Interactions
CD spectra can also be used to study protein interactions. When proteins bind with other molecules or ligands, changes may occur in their CD spectra. For example, after binding with a ligand, the position and intensity of characteristic peaks in the spectrum might change. By comparing spectra under different conditions, we can reveal the mechanisms of interaction between proteins and other molecules.
3. Applications of Circular Dichroism Spectroscopy
CD spectroscopy is widely used in the field of biopharmaceuticals. Here are some common applications:
1. Protein Structure Research
CD spectroscopy can be used to study protein structures. By analyzing spectra, we can understand the secondary structure composition, folding state, and stability of proteins, thereby revealing their structural characteristics and functional mechanisms.
2. Drug Development
CD spectroscopy plays an important role in drug development. By analyzing changes in the spectra after proteins interact with drugs, we can assess the binding ability and selectivity of drugs, thus guiding drug design and optimization.
3. Quality Control in Biopharmaceuticals
In the biopharmaceutical field, CD spectroscopy can be used for quality control of biopharmaceuticals. By analyzing the CD spectra of proteins, we can evaluate their structural integrity and stability, ensuring the quality and efficacy of biopharmaceuticals.
Conclusion
Circular dichroism spectroscopy is an important technique for revealing conformational information about proteins. By analyzing spectra, we can understand the secondary structure, folding state, and interactions of proteins, thereby deeply researching their function and interaction mechanisms. In the biopharmaceutical field, CD spectroscopy has wide applications, including protein structure research, drug development, and quality control in biopharmaceuticals. With continuous development and innovation, CD spectroscopy will bring more breakthroughs and advancements to the field of biological research.
Bio-Techne Biotech -- BioproductCharacterization, a leading service provider in multi-group biological mass spectrometry testing
Related Services:
Protein Circular Dichroism Analysis
Circular Dichroism Analysis (CD)
How to order?
